ECG Control - User Manual
Dear user, the software ECG Control for our USB electrocardiograph is updated on a regular basis. It is recommended to keep up to date on the latest version. The newest version is available here.
We recommend you to become familiar with this manual before you start your work with the device.
The computer attachment ECG Light along with the software ECG Control allows recording an electrocardiogram, saving it to a file and performing automated ECG interpretation.The sections of this manual (the table of contents):
First of all, download and install the program ECG Control to your computer. Open the folder that contains the “ECG_ControlSetup.exe” file and click on the file to run the install process. Click "Next" in the install window. Then choose an installation directory where an ECG Control application stores its program files. You may not change the default installation directory. Then a new window offers to create a shortcut on the Desktop and icon in the Quick Access Toolbar. After you click the Install, it will begin the install process. When the process is finished, a new window appears offering you to run the program and to install the driver for the device. Click "Finish" to finish installing ECG Control.
Notes Bear in mind that sometimes the driver installation may not be successful during the application setting-up. In that case run the driver installation process manually from the main menu (The Start menu—>All programs—>ECG Control —>Driver installation).
1 The program allows working in ECG Viewing mode without the ECG attachment. It performs the visualization and automated interpretation of recorded ECG signals (using ECG Light).
2The driver can be installed only if the device ECG Light is connected to the PC.
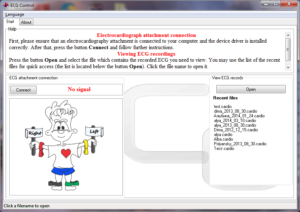
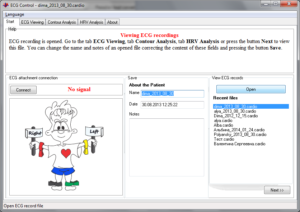
The program works in two modes: ECG recording mode and ECG Viewing one. When you press the Button Connect the program automatically switches the mode to recording an ECG signal. When you press the button Open it change the mode to viewing ECG.
The connection of the device to your PC
Ensure that the device is intact and connected to your PC before recording an ECG signal. After connecting the device to
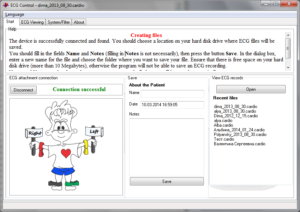
the computer, press the button Connect in the program main window. If the connection is successful, the message Successful connection will appear.
If the device is successfully connected and found, you should create a work file before starting recording.
You should fill in the fields Name and Notes (filling in Notes is not necessarily), then press the button Save. In the dialog box, enter a new name for the file and choose a location on your hard disk drive where an ECG file will be saved. Ensure that there is free space on your hard disk drive (more than 10 Megabytes), otherwise the program will not be able to save an ECG recording. Name and Comments can be changed at any moment you need, all changes will be saved
automatically.
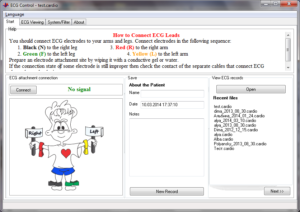
You should connect ECG electrodes to your arms and legs. Connect electrodes in the following sequence:
1. Black (N) to the right leg
2.Green (F) to the left leg
3. Red (R) to the right arm
4. Yellow (L) to the left arm
Prepare an electrode attachment site by wiping it with a conductive gel or water. If the connection state of some electrode is still improper then check the contact of the separate cables that connect ECG electrodes to the device. If the connection is successful, the appropriate message will appear. While an ECG signal is recording, you should be relaxed, because a muscle tremor and movements can result in sizable signal distortions. Click Next and go to the tab ECG Viewing.
Starting and ending an ECG record
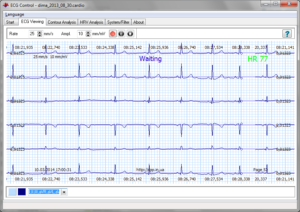
You should use the waiting mode that allows the preview of a recording to select the desired moment of a record beginning.
Bear in mind that the data (an ECG signal and heart rate) are continuously received from the device but they are not saved to a file in this mode. Use the button Start recording (it looks like a red circle) and Stop recording (as a conventional sign for stop a record). The button Pause lets you suspend recording. When you need to resume recording, just click Pause again. If you press the button Start recording after finishing it, then a previous record will be replaced by a new one. The desired scale of ECG viewing is set by means of the parameters Rate and Amplitude (Ampl.). If you want to change the color of grid lines (graph paper) and ECG curves, click on the appropriate color field in the left bottom corner of the program window and choose the color you need in a color palette. The display options of an ECG don't influence on the process of its recording.
If you need to view an ECG recording, click the button Open in the main program window. To open an ECG file, in the Open dialog box, double-click the name of the file which contains the recorded ECG you need to view. You may use the list of the recent files for quick access (the list is located below the button Open). Click the file name to open it. Then click Next.
Automated ECG interpretation (contour analysis of an ECG signal)
Contour analysis is the standard method of ECG interpretation that can be performed automatically or manually. It consists in the measurement of the temporal intervals and wave amplitudes of a heartbeat pattern. The program is able to perform the automated interpretation of an ECG recording. A subsequent diagnostic decision is based on the measured abnormalities in temporal and morphological features.
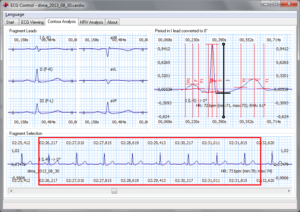
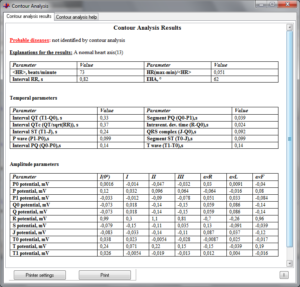
Use a horizontal scrollbar at the bottom of the main program window in the region Fragment Selection to select the desired part of an ECG recording. You should use the red selection rectangle to specify the borders of the fragment to be analyzed. You can shift it pressing and holding the left mouse button down while moving the cursor to the right and to the left. If you want to change the duration of the selected fragment, you should carry out the same action while holding the right mouse button instead of the left one. The limb leads I, II, III and augmented limb leads aVR, aVL, and aVF which form the points of what is known as Einthoven's triangle are displayed in the region Fragment leads. There is the heartbeat which is obtained by the averaging over all the cardiac cycles of a selected fragment in the region Period in I lead converted to 00. The markers of characteristic signal points are placed automatically provided that their location has not been changed manually before. You can change the location of a marker holding the left mouse button down while moving the cursor. The fixation of markers is reset using the pop-up menu item Place markers automatically. The numerical values of ECG parameters and their interpretation are displayed in the secondary window Contour Analysis on the page Contour Analysis Results.
If you want to copy the content of contour analysis results to clipboard (as a text), then use the conventional key combinations Ctrl+A, Ctrl+C, and Ctrl+V for pasting to a document. You can view and change or add new abnormality interpretations, using the special program tab Diagnoses Database Editor, that becomes available after pressing the button "!" located in the right bottom corner of the page Contour Analysis Results.
Note:
While working with the tool Diagnoses Database Editor, bear in mind that the number 0 serves as a sign of an ignored parameter. If you need to set the number "0" as the value that is taking into account, then set arbitrarily small value, for instance 0,001.
If you need to print an ECG recording which is displayed on the page Contour Analysis or interpretation results, click Print on the page Contour Analysis Results. Ensure that there are two sheets of paper (minimum) in your printer (for a recording and for results). You can change printer settings using the Print dialog box that appears after pressing Printer settings.
Heart rate variability analysis
HRV analysis allows estimating a functional body state. The method is based on the measurement of variations in the time interval between heartbeats and includes the statistical and spectral analysis of derived data. Bear in mind that HRV analysis results don't provide the patients having an artificial pacemaker or suffering from arrhythmias with valuable diagnostic information. The duration of an ECG recording for subsequent HRV analysis must be 5 minutes (or more). 300 beats needed for the correct implementation of HRV analysis are selected by the program automatically. The beginning of a signal to be analyzed is used by a user. If the number of beats is less than 300, it is impossible to compare the results obtained from HRV analysis or even to rely on the automatic diagnostic decisions of the program. You can choose the beginning of a fragment to be analyzed either on the page ECG Viewing of the program interface page or on the page HRV analysis using the scrollbar that is located at the top of the page. There are a rhythmogram, histogram (bar graph) and Poincare plot, and an approximated continuous probability distribution of cardiointervals on the page HRV analysis. The text field at the bottom of the page is destined to output the description of automatic diagnostic results and the most important statistical parameters.
Having gone to the tab ECG Viewing, you can see an ECG signal in I, II and III and augmented aVR, aVL, aVF limb leads. It's worth noting that the signal display options are adjustable, i.e. you can choose the leads you need to view and hide the rest using the drop-down menu in the left bottom corner of the program window.
Use a navigation bar for viewing ECG recordings with the help of a scrollbar or specifying the page number that needs to be viewed. The desired scale of ECG viewing is set by means of the parameters Rate and Amplitude (Ampl.). If you want to change the color of grid lines (graph paper) and ECG curves, click on the appropriate color field in the left bottom corner of the program window and choose the color you need in a color palette.
The printout of ECG recordings is available for any printer that is installed in the system (connected to your PC) in this mode. If you can't see the buttons Printer… and Print, it means that no available printers are found in the system. Press Printer… to open the Print dialog box that allows selecting options for a particular print job. Bear in mind that if you press the button Print without specifying the desired duration of an ECG fragment, the program will print one page (it contains 5-seconds fragment). That is why set the desired duration of the fragment to be printed using the spin buttons that are located near the button Printer… As a result the fragment with the desired duration from the current page will be printed. An ECG recording is printed out with the same parameters (Rate, Amplitude, and line color) as you see on your screen.
Exporting an ECG record to a text file
The program lets you export the fragment of ECG recordings to a text file that is convenient for the processing with the help of a table processor (for instance, MS Excel), your own applications or engineering calculation software (Matlab, Mathcad).
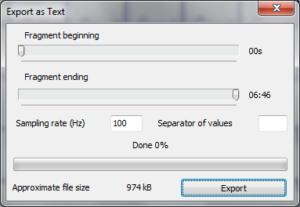
Click the right mouse button in the field of ECG signals in the viewing mode to call the pop-up menu. Select the item "Export to a text file" from the pop-up menu and point the desired parameters in the Export program window. Set the desired sampling rate, the beginning and end of a fragment, values separator character (default
separator character is space) and click Export. Select a location on your computer where the exported file will be saved and point the name of the file. Wait till the export process ends. As a result, the potential values in all the leads with the desired sampling rate will be written to the file. Each line contains the potential values in one ECG lead that are expressed in microvolts and separated by the desired separator character.
To close the application click the Close button in the upper-right corner of the window.


 Next Post


